Relative frequency
What does frequency tell us
Frequency expresses what percentage an observation represents of the total number of observations.
We have collected our observations like this:
- 150-159 cm tall absolute frequency = 2, relative frequency = 20 %
- 160-169 cm tall absolute frequency = 5, relative frequency = 50 %
- 170-179 cm tall absolute frequency = 3, relative frequency = 30 %
Our total number of observations n = 10
We calculate it like this:
$$ \text{150-159 cm} = \frac{2}{10} = 0.20 = 20\% $$
Formula
It can be written as a formula like this:
$$ Frequency=\frac{absolute\ frequency}{\text{number of observations}} \Leftrightarrow $$
$$ f(x) = \frac{h(x)}{n} $$
If you add all your frequencies together, they must always equal 100 %
Or 1, if you calculate with decimals.
You can also show your frequencies in a diagram.
A pie chart is good for showing percentage distribution (often called a "cake chart"), but if you have to draw it by hand, a square diagram or a stacked diagram is easier.
Frequency diagram
![]()
Cumulative frequencies
A cumulative frequency shows what percentage of the observations are less than or equal to a given limit.
In other words, the frequencies are added together step by step.
| Interval | Frequency | Cumulative frequency |
|---|---|---|
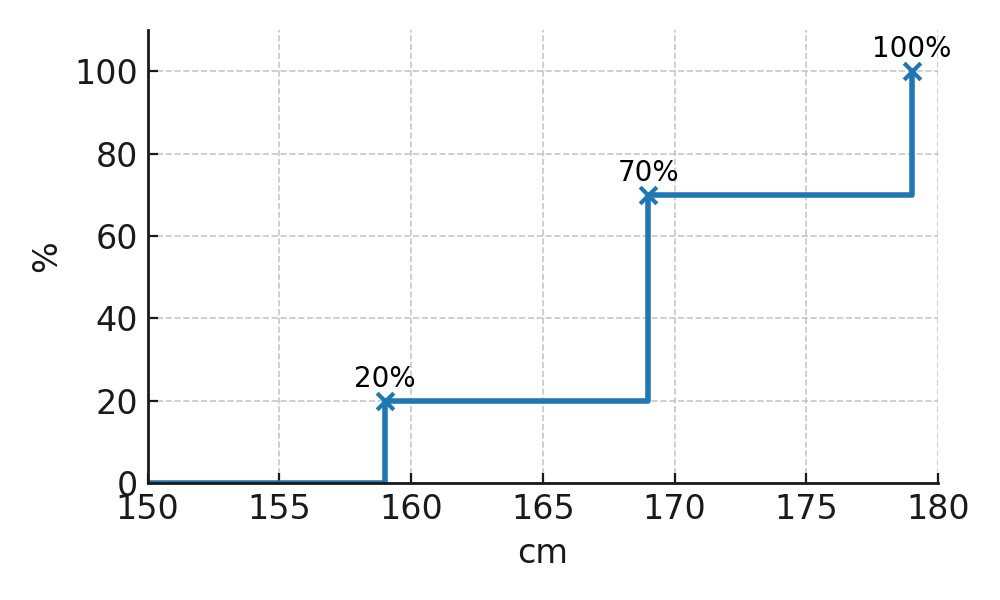
| 150-159 cm | 20 % | 20 % |
| 160-169 cm | 50 % | 70 % |
| 170-179 cm | 30 % | 100 % |
From the table you can see that 70 % of the students are at most 169 cm, and that all (100 %) are below 179 cm.
The x-axis shows the height in cm and the y-axis the cumulative frequency in percent: