Statistics and probability
Statistics
Statistics is about collecting, organizing, and processing data.
A dataset can, for example, show how many children live in different regions. With that knowledge, one can plan how many schools and teachers are needed.
Data can also be exam grades or results from a survey. Data can be collected through questionnaires, measurements, or observations.
Probability
Probability describes how likely it is that a specific event will happen.
It can be the chance of winning the lottery or the probability of rolling a six with a die. In such cases, one can calculate it precisely.
In other situations, statistics are used to assess probabilities. For example, by analyzing many years of weather data, one can calculate averages and from that make forecasts of what is normal and therefore likely.
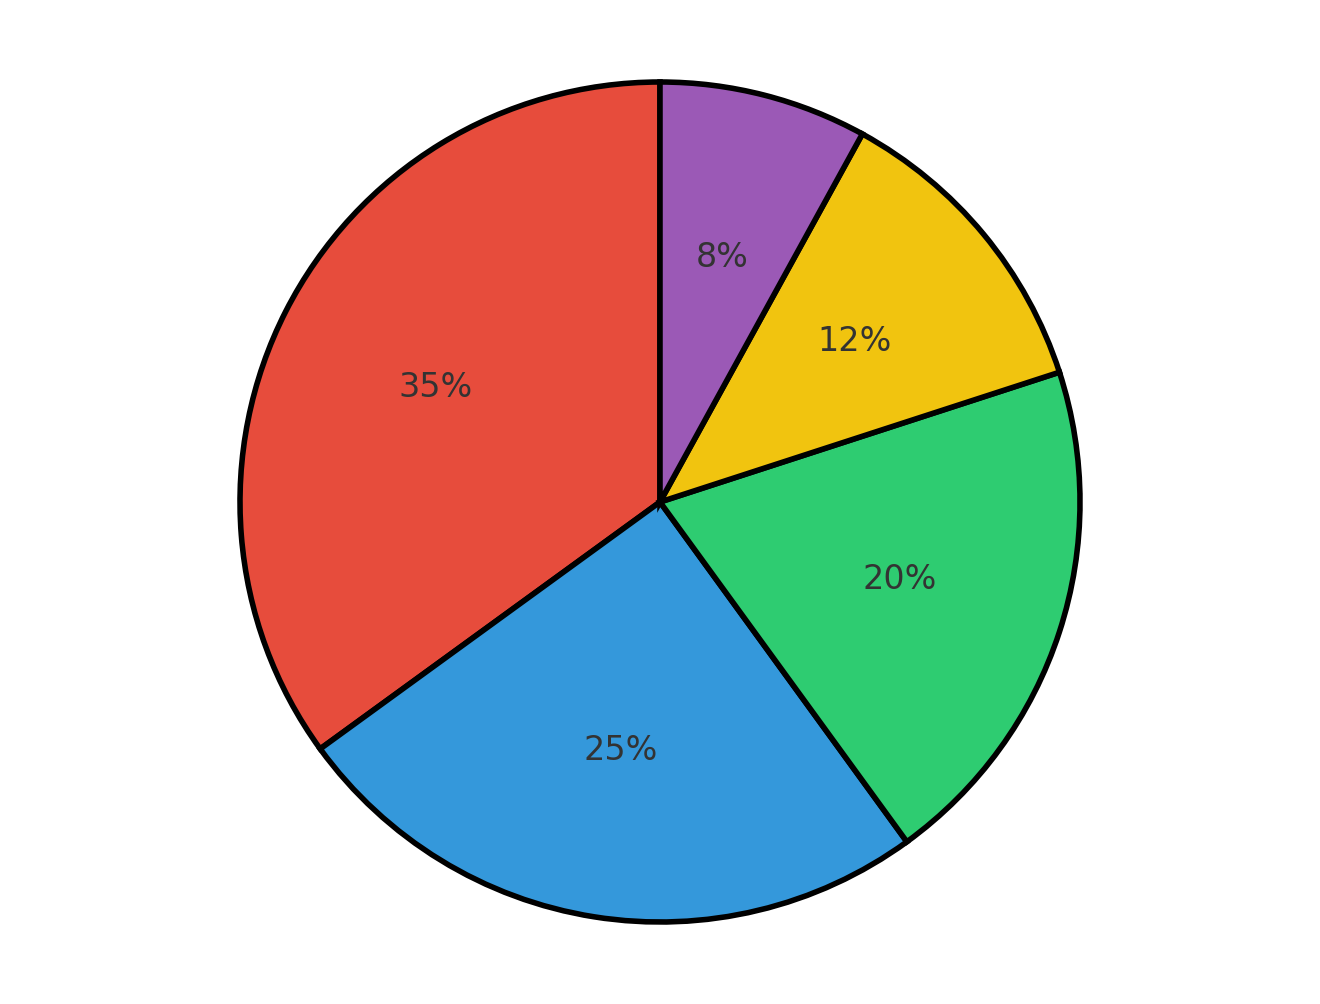
Charts
Statistics are often presented in charts, making patterns easier to see.
One can choose between many types: bar charts, pie charts, histograms, box plots, and several others – depending on what best fits the data.