Absolute frequency
Your observation
You have made an observation of 10 students in your class.
In the table below, you can see how tall they are.
| Name | Height |
|---|---|
| James | 176 cm |
| Oliver | 172 cm |
| Emma | 160 cm |
| Sophia | 161 cm |
| William | 170 cm |
| Ava | 167 cm |
| Benjamin | 156 cm |
| Mia | 160 cm |
| Lucas | 168 cm |
| Charlotte | 158 cm |
Absolute frequency and intervals
Absolute frequency means how many times an observation appears in a data set.
In our case, most observations occur only once, so we can divide them into intervals.
We divide them into three intervals with 10 cm each.
Now we can see how often different heights appear.
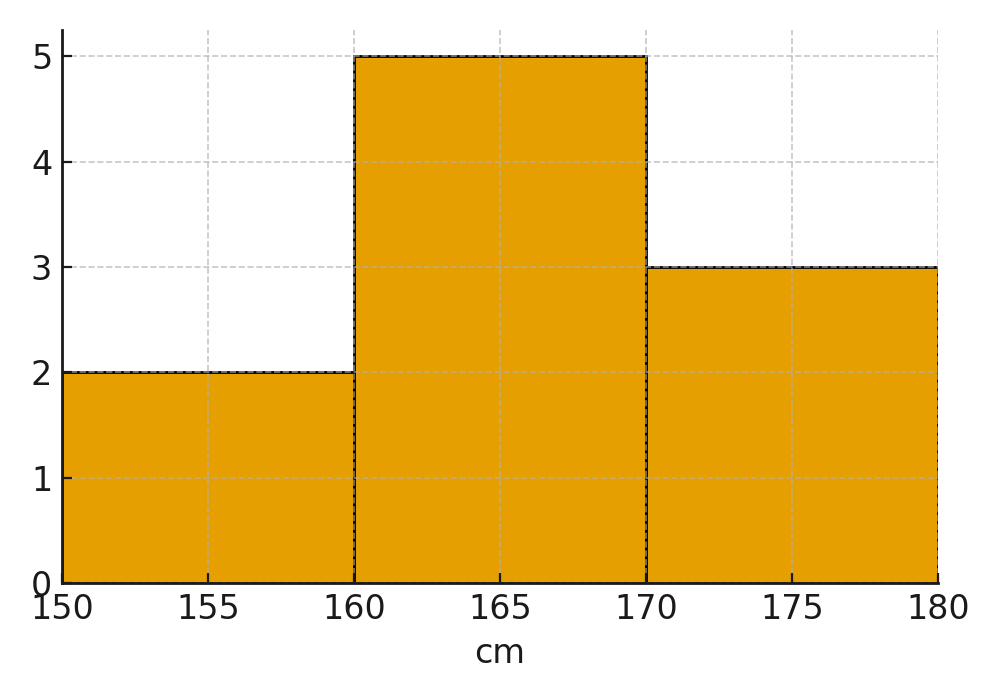
| Height cm | 150-159 | 160-169 | 170-179 |
|---|---|---|---|
| Absolute frequency h(x) | 2 | 5 | 3 |
As you can see, most students are between 160–169 cm tall.
Histogram
A histogram looks like a bar chart, but here the bars are placed directly next to each other without gaps. This is because the intervals cover a continuous range of numbers.
Histograms are especially used when the observations are measured in numbers that can vary continuously, such as height, weight or time.
In a histogram you can quickly see the distribution of the data and assess whether it is symmetric, skewed or has special patterns.