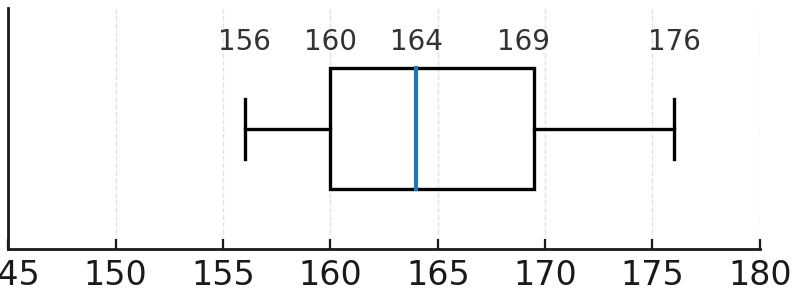
Box plot
A box plot is a type of diagram often used to show the different values of the observations.
It is built as a box with two whiskers. The size of the box corresponds to half of the observations.
If the median is not in the middle of the box, it means that the observations are skewed. One speaks of left skewness or right skewness depending on which side the distribution is pulled towards.
In our case it is so, and if you look at the observations, you can see why.
There are more below the median with a height equal to or close to the lower quartile, while they are more spread out above the median.
This causes the median to be smaller.
Values
A box plot is based on a five-number summary: minimum, lower quartile, median, upper quartile and maximum.
We use the values from the observation of the students’ height from the previous pages.
| Minimum value | 156 |
| Lower quartile | 160 |
| Median | 164 |
| Upper quartile | 170 |
| Maximum value | 176 |
Diagram
In the diagram you can see how the numbers are placed visually.