Statistical probability
Probability can be calculated in two ways: theoretical (classical) and statistical (empirical).
Classical probability
If the sample space is known and all outcomes are equally likely, one can use the formula:
$$ \large P(A) = \frac{\text{number of favorable outcomes}}{\text{number of possible outcomes}} $$
Example: The probability of rolling a six with a die is:
$$ \large \frac{1}{6} \approx 0.167 = 16.7\% $$
Statistical (empirical) probability
Sometimes the probability cannot be calculated directly. Instead, one performs trials or experiments and uses the observations to calculate the probability.
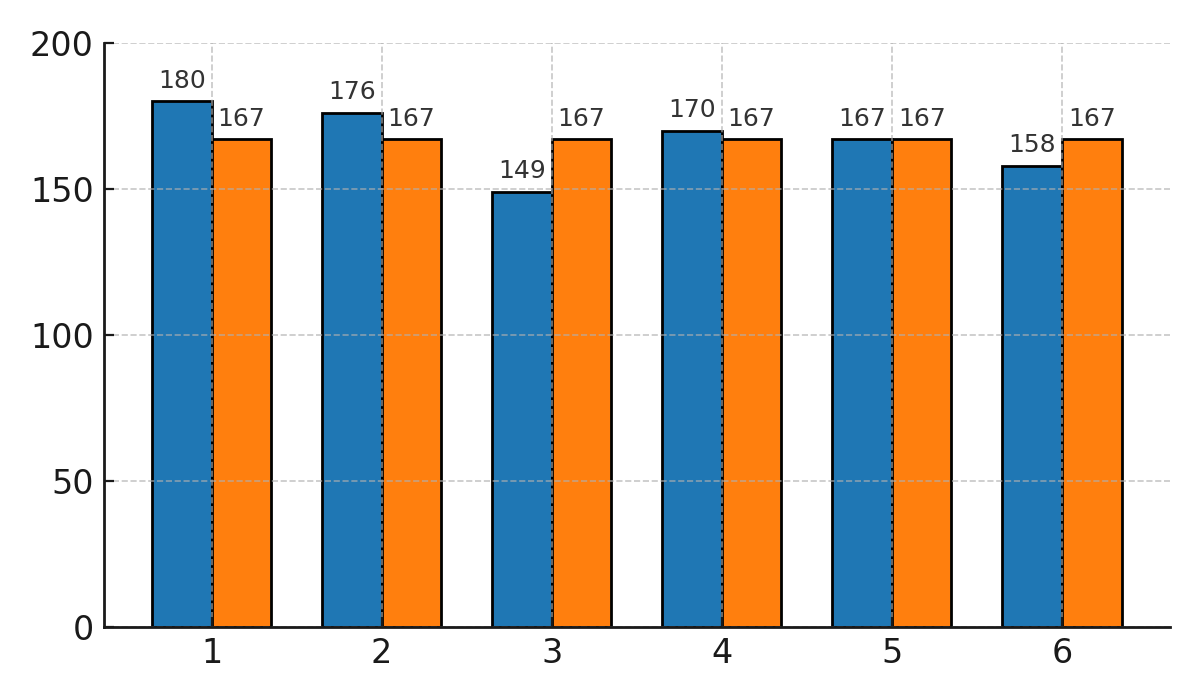
Example: We roll a die 1,000 times and record frequency and relative frequency:
| 1 | 2 | 3 | 4 | 5 | 6 | |
|---|---|---|---|---|---|---|
| $$ h(x) $$ | $$ 180 $$ | $$ 176 $$ | $$ 149 $$ | $$ 170 $$ | $$ 167 $$ | $$ 158 $$ |
| $$ f(x) $$ | $$ \tfrac{180}{1000} $$ | $$ \tfrac{176}{1000} $$ | $$ \tfrac{149}{1000} $$ | $$ \tfrac{170}{1000} $$ | $$ \tfrac{167}{1000} $$ | $$ \tfrac{158}{1000} $$ |
| Expected | $$ \tfrac{1000}{6} \approx 167 $$ | $$ 167 $$ | $$ 167 $$ | $$ 167 $$ | $$ 167 $$ | $$ 167 $$ |
Diagram
The bar chart below shows the theoretical probability (167 for each side) compared with the empirical outcomes.
Comparison
We know that the probability of rolling a six is:
$$ \large \tfrac{1}{6} \approx 0.167 = 16.7\% $$
Our experiment instead showed:
$$ \large \tfrac{158}{1000} = 0.158 = 15.8\% $$
The result is not exactly the same as the theoretical value, but it is close. This shows how statistical probability is used to approximate the theoretical probability through observations.
Statistical probability is therefore a practical tool when one cannot calculate the probability directly, but instead must rely on observations.